A forklift brakes hard at a blind intersection. A pedestrian steps into a travel lane near the dispatch desk. A truck begins to move before loading is complete. Each event may end without an injury, but each is evidence of a control that needs attention. Safety analytics helps operations teams turn these near misses, observations, and equipment signals into action before a serious accident occurs.
For warehouses, factories, logistics hubs, and loading bays, safety performance cannot be measured only by injury counts. An incident rate tells you what has already gone wrong. It does not reliably show where forklift-pedestrian interactions are increasing, which dock doors create repeated exposure, or whether a traffic-control measure is working during the busiest shift. Analytics provides that earlier view.
What Safety Analytics Should Measure
Safety analytics is the disciplined use of operational and safety data to identify hazards, measure risk patterns, and verify whether corrective controls are reducing exposure. The purpose is practical: help workers return home safely, protect facilities and equipment, and keep operations moving without preventable disruption.
The strongest programs combine lagging indicators with leading indicators. Lagging indicators include recordable incidents, equipment damage, rack strikes, and lost operating time. They remain valuable because they show the cost and severity of failures. But they are not enough on their own.
Leading indicators reveal conditions that could produce an incident. In industrial environments, these may include frequent speeding alerts in a forklift zone, repeated pedestrian proximity warnings, hard-braking events near intersections, missed vehicle restraint checks, or recurring obstruction reports at emergency access routes. A single alert may not mean a process has failed. Repeated events in the same location, shift, or workflow usually deserve investigation.
Context matters as much as volume. Ten proximity alerts at a crossing might indicate poor pedestrian behavior, but they could also point to an unmarked shortcut, a congested staging area, a poorly positioned rack end, or an outbound schedule that forces people and vehicles into the same space. The data should start a focused site conversation, not assign blame automatically.
Use data that reflects real exposure
A useful safety dashboard connects events to operational activity. For example, comparing forklift impacts by total operating hours is more meaningful than comparing raw impact counts between two sites of different sizes. Similarly, loading bay incidents should be assessed against dock movements, shift patterns, vehicle types, and loading activity.
This prevents false confidence. A site may report fewer impacts simply because throughput declined. Another site may report more alerts after installing a proximity warning system, not because it became less safe, but because it can finally see interactions that were previously unrecorded. Good analysis asks what changed in both risk exposure and visibility.
The Warehouse Risks Analytics Can Expose
Forklift and pedestrian interaction is often the highest-value area for analysis because the consequences can be severe and the risk can change quickly with traffic flow. Data from warning systems, vehicle telematics, operator reports, and supervisor observations can identify where vehicles reverse most often, where pedestrians enter active lanes, and when visibility is compromised by pallets, trailers, or racking.
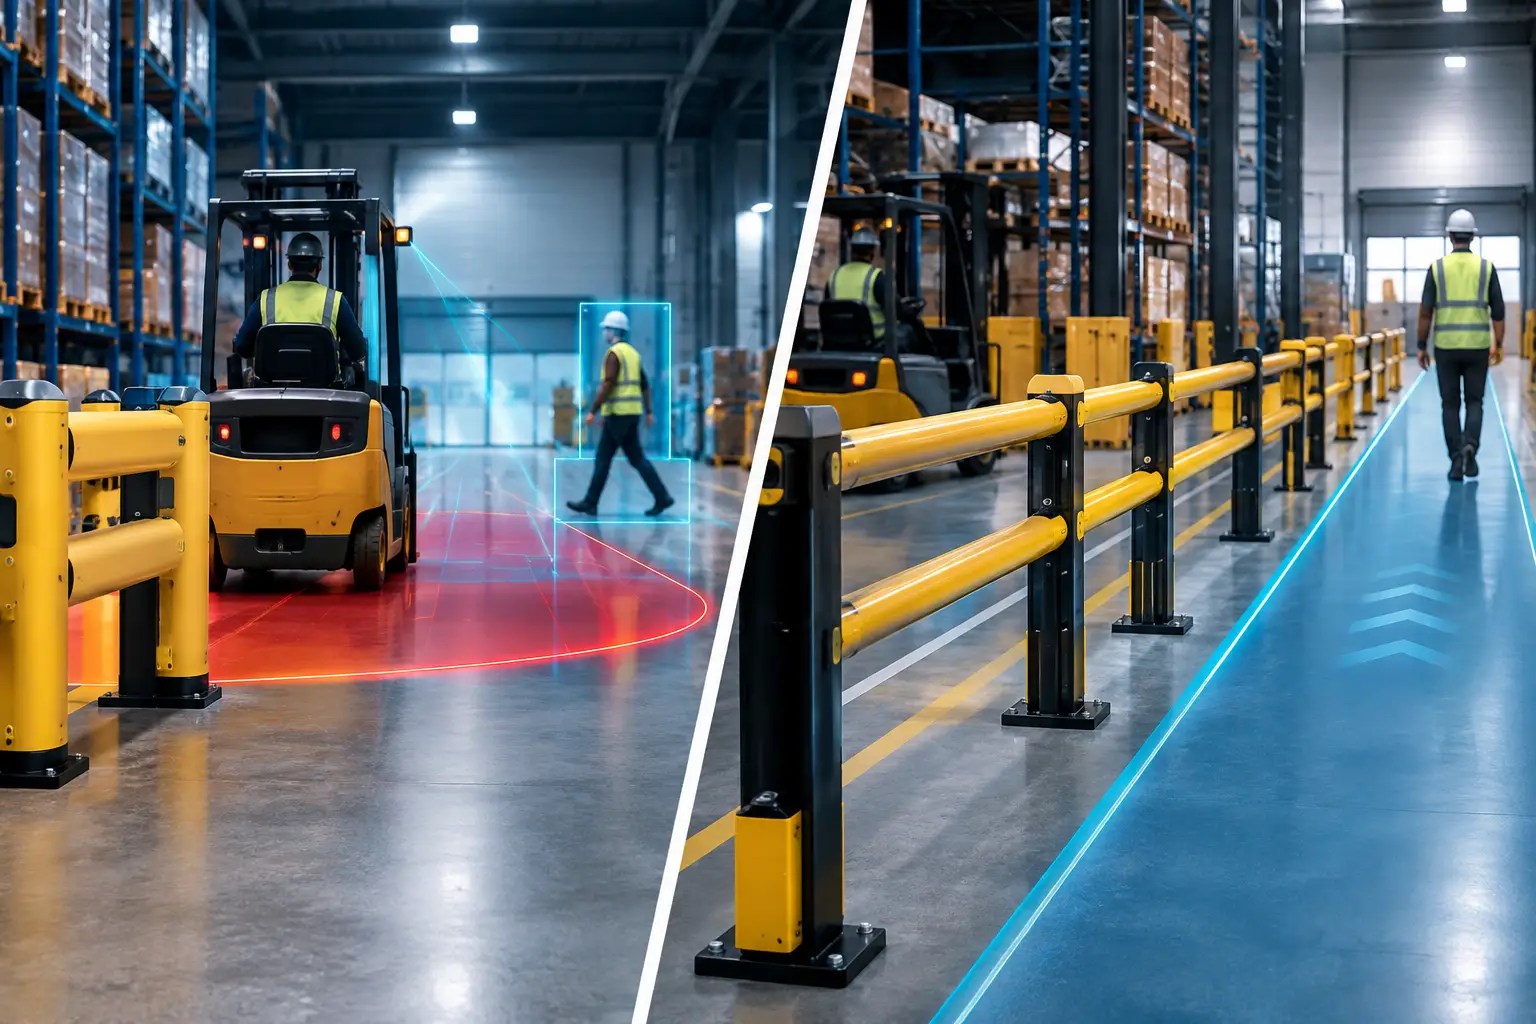
Blind corners deserve particular attention. Repeated near-miss alerts at an intersection may justify a combination of controls: revised travel routes, physical barriers, speed reduction, floor projection, audible or visual warnings, and improved line marking. The right response depends on the layout and process. Installing a warning device without addressing traffic design may reduce awareness while leaving the underlying conflict in place.
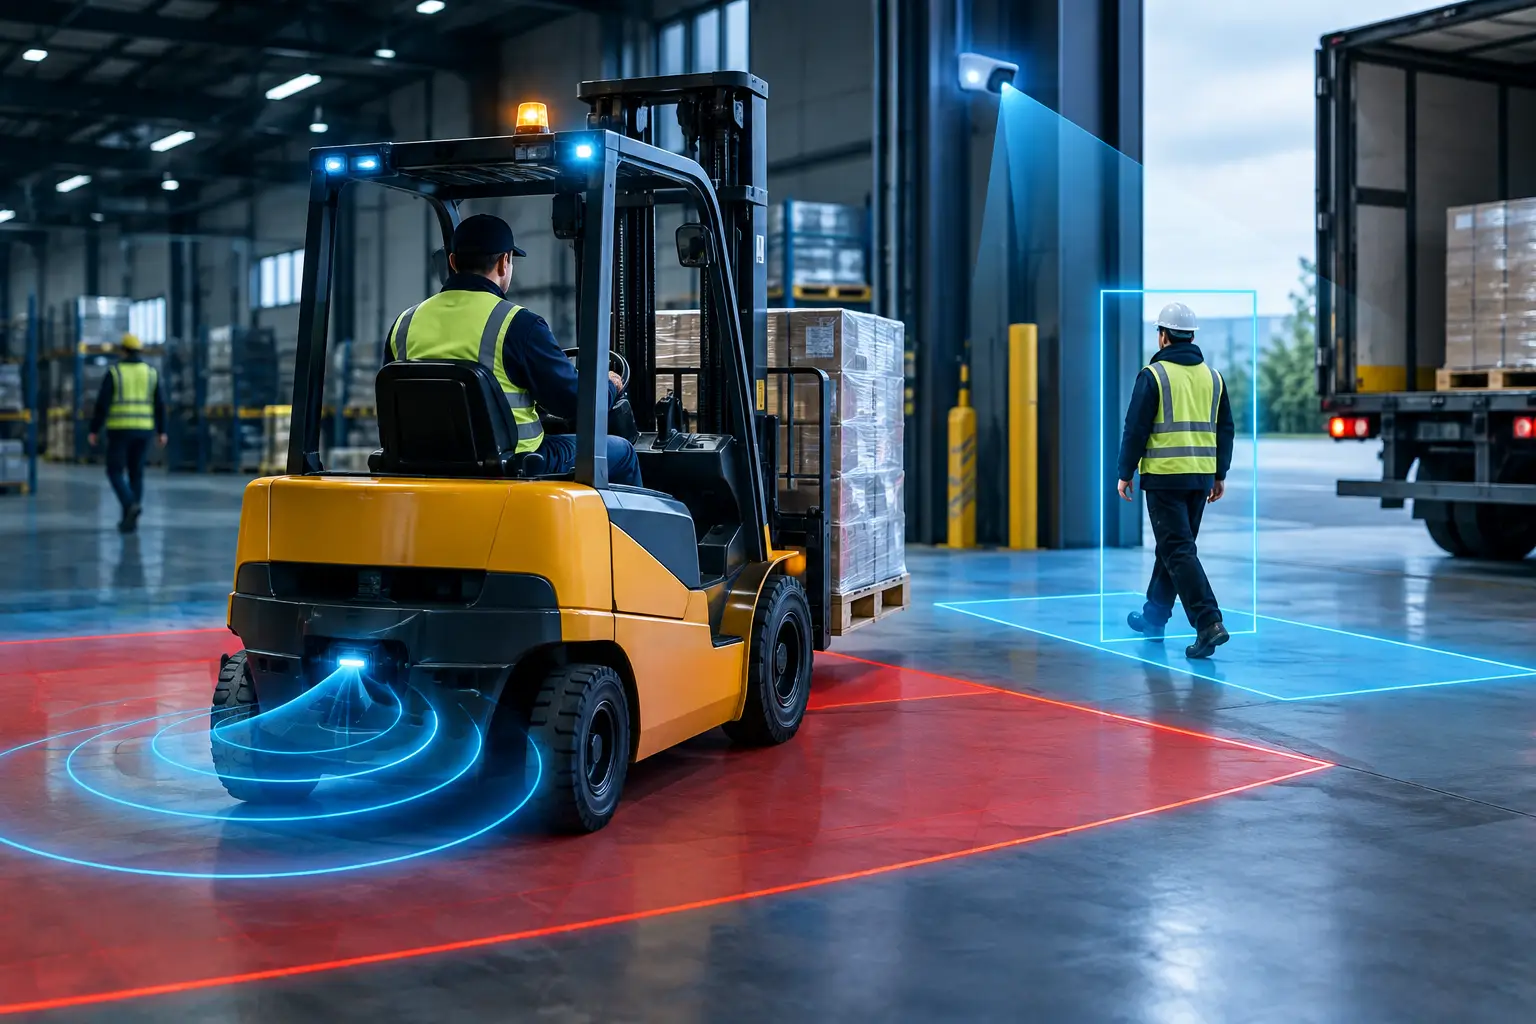
Loading bays are another area where analytics can clarify risk. Review patterns involving early truck departure, trailer movement, incomplete loading confirmation, or near misses between people and vehicles. If events cluster at a few doors, the issue may be a damaged restraint, an inconsistent driver process, poor communication between the warehouse and yard, or pressure during peak dispatch periods.
Rack and facility damage should also be treated as a safety signal, not just a maintenance cost. A recurring rack strike can indicate inadequate aisle width, poor visibility, insufficient rack-end protection, unsuitable forklift travel patterns, or training gaps for a specific task. Trend the location, damage type, vehicle involved, and shift. That information helps engineering and operations teams choose a targeted correction rather than repeatedly repairing the same asset.
Build a Safety Analytics Process That Leads to Change
Data collection has little value if the review process is slow, unclear, or disconnected from daily operations. An effective approach begins with a limited number of material risks. For many sites, that means forklift-pedestrian collisions, loading bay movement, vehicle speed, rack impacts, and hazardous congestion points.
Start by defining what an event means. A hard-braking alert, for example, should have a consistent threshold and review method. A near miss should be easy for employees to report without fear of unfair discipline. Equipment damage should be categorized consistently, even when it appears minor. Clear definitions produce cleaner trends and better decisions.
Next, assign ownership. EHS teams may lead the risk review, but warehouse managers, engineering leaders, supervisors, and maintenance teams each hold part of the solution. A weekly review of high-risk events can address immediate hazards. A monthly trend review can assess recurring locations, control performance, and resource priorities.
The review should lead to a specific question: what condition allowed this exposure to occur? That question is more useful than asking who made the mistake. Human behavior matters, but workers operate within the routes, schedules, visibility constraints, equipment conditions, and production pressures the facility creates.
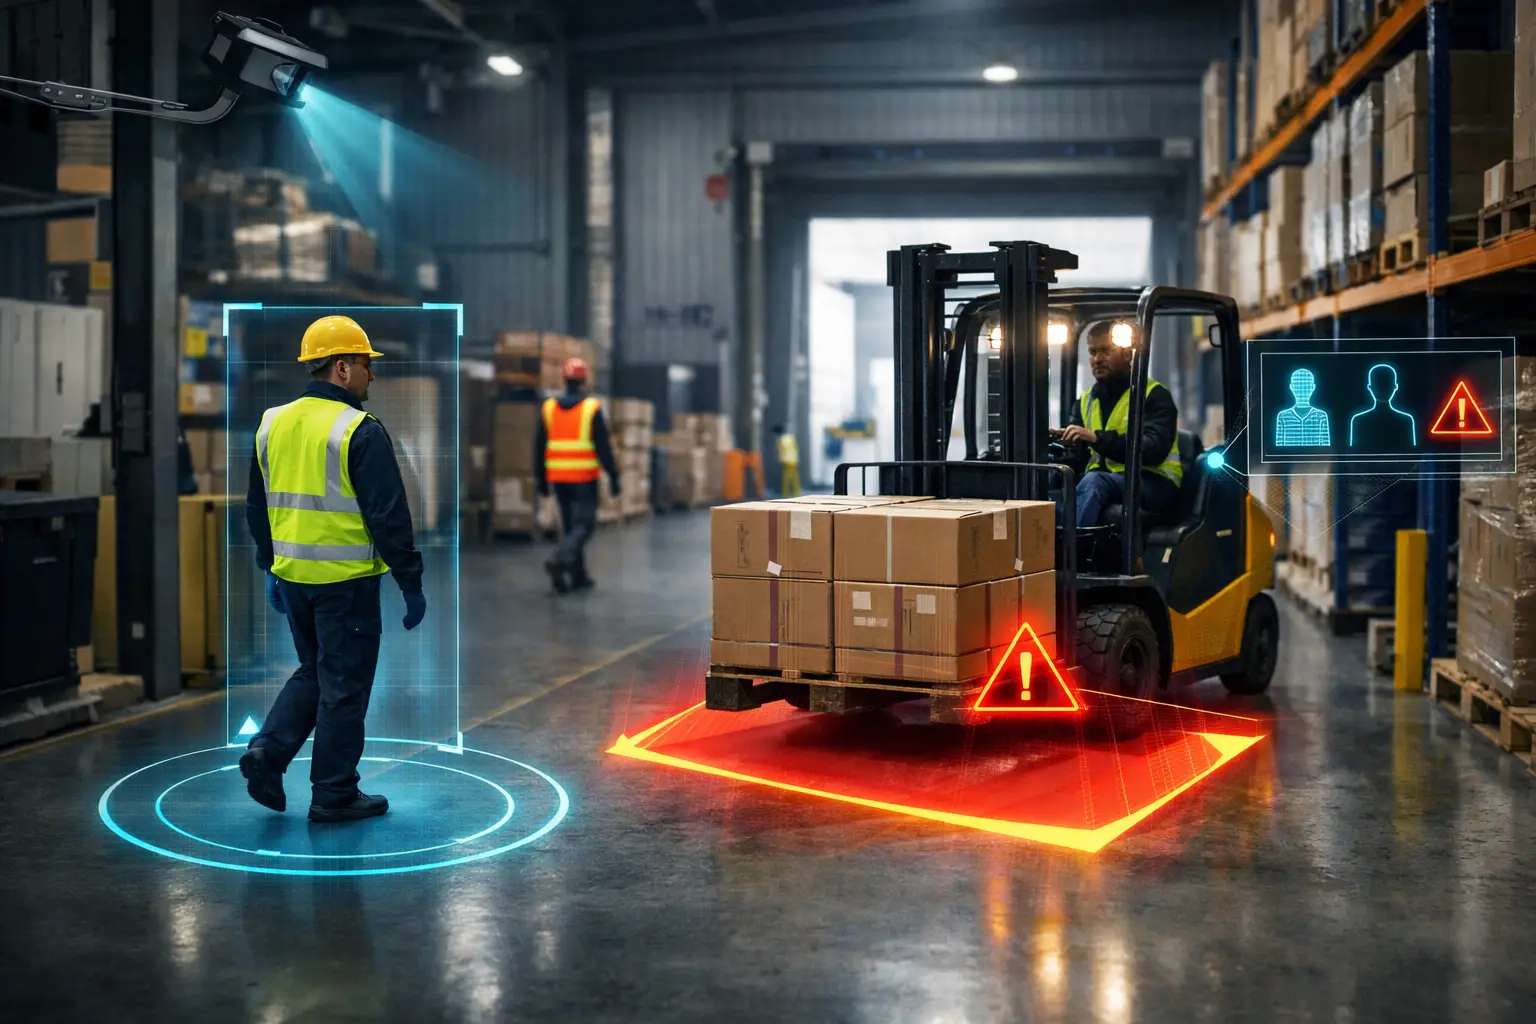
When a pattern is confirmed, select controls using the hierarchy of effectiveness. Separating pedestrians and forklifts with barriers or redesigned routes is generally stronger than relying only on signs. Vehicle restraint systems can prevent trailer movement at a loading bay more reliably than a reminder alone. Vision AI safety monitoring and intelligent warning systems can provide timely intervention where separation is not fully possible, especially around high-traffic crossings and restricted zones.
Technology should support the control plan, not replace it. A visual alert can warn an operator and pedestrian of an immediate conflict, but it cannot compensate for an aisle that is routinely blocked by inventory. Vision AI can identify unsafe zone entry and recurring behaviors, but teams still need a process to verify the event, correct the condition, and communicate the change.
Validate the result after implementation
Every safety improvement should have a measurable success condition. If a barrier is installed at a pedestrian crossing, the expected result may be fewer zone-entry alerts and fewer observed conflicts during peak activity. If forklift speed controls are introduced, review whether speeding events decline without creating new congestion at picking or dispatch areas.
Allow enough time to observe normal operating variation. A one-week improvement may reflect lower volumes, a holiday period, or temporary supervisor attention. Compare similar shifts and workloads where possible. Speak with operators and floor staff as well. Their experience can reveal whether a control is intuitive, difficult to follow, or creating an unintended workaround.
This validation step also protects investment decisions. Safety technology produces better outcomes when organizations can demonstrate where it is needed, how it was configured, and whether it reduced the targeted exposure. The same evidence supports internal safety reviews, operational planning, and practical compliance efforts.
Avoid Common Analytics Mistakes
The first mistake is collecting more data than the team can act on. Hundreds of alerts without prioritization can create alarm fatigue. Focus attention on severity, frequency, location, and repeat patterns. A low-volume event with high potential consequence may deserve faster action than a large number of low-risk notifications.
The second is treating all sites and shifts as identical. A distribution center with seasonal peaks has different traffic exposure from a manufacturing facility with fixed production cells. Day and night shifts may also use different staffing levels, layouts, and material flows. Segmenting the data helps reveal risks that averages conceal.
The third is using analytics solely as an enforcement tool. If employees believe every report will be used to punish someone, near-miss reporting will fall and the organization loses visibility. Accountability still matters, particularly for deliberate unsafe conduct, but a prevention-focused process encourages early reporting and stronger learning.
Finally, do not wait for a serious incident to establish a baseline. Start with site observations, current incident records, equipment damage reports, and available warning-system data. Even imperfect information can identify the first priority area. As processes become more consistent, the quality of the analysis improves.
For operations leaders, the value of safety analytics is not a more complicated dashboard. It is the ability to see risk early enough to change a route, strengthen a control, repair a recurring hazard, or redesign a task before someone is hurt. Every signal is an opportunity to make the workplace safer by design.